Web Servers and Databases
The Human Metabolome Database (HMDB) is a freely available database containing detailed information about small molecule metabolites found in the human body. It is intended to be used for applications in metabolomics, clinical chemistry, biomarker discovery and general education. The database is designed to contain or link three kinds of data: 1) chemical data, 2) clinical data, and 3) molecular biology/biochemistry data. HMDB contains over 41,000 metabolite entries including both water-soluble and lipid soluble metabolites as well as metabolites that would be regarded as either abundant (> 1 uM) or relatively rare (< 1 nM). Additionally, approximately 7200 protein (and DNA) sequences are linked to these metabolite entries.
References:
4. Wiki: http://en.wikipedia.org/wiki/HMDB
5. Wishart DS et al., HMDB 5.0: The Human Metabolome Database for 2022, Nucleic Acids Research (2021)
The Serum Metabolome Database is a freely available electronic database containing detailed information about 4651 small molecule metabolites found in human serum along with 10895 concentration values. The data tables may be sorted and searched by concentration values and ranges. The information includes literature and experimentally derived chemical data, clinical data and molecular/biochemistry data.
References:
BacMap is an interactive visual database containing all publicly available bacterial genomes. A fully labeled and zoomable genome map is provided for each genome. Sequence and text queries can be used to identify genes of interest, or maps can be navigated using a simple interface. BacMap is designed to serve as an intuitive and convenient tool for identifying orthologues and paralogues, studying operon conservation, and determining gene function.
References:
2. Wiki: http://en.wikipedia.org/wiki/BacMap
The Fecal Metabolome Database is a freely available electronic database containing detailed information about many small molecule metabolites found in human feces and many concentration values. Each metabolite entry contains more than 110 data fields and many of them are hyperlinked to other databases (KEGG, PubChem, ChEBI, Chemspider, DrugBank, PDB and Uniprot). The information includes literature and experimentally derived chemical data, clinical data and molecular/biochemistry data.
The DrugBank database is a unique bioinformatics and cheminformatics resource that combines detailed drug (i.e. chemical, pharmacological and pharmaceutical) data with comprehensive drug target (i.e. sequence, structure, and pathway) information. The database contains over 7,800 drug entries nearly 2,200 FDA-approved small molecule drugs, 340 FDA-approved biotech (protein/peptide) drugs, 93 nutraceuticals and >5,000 experimental drugs. Additionally, more than 3,500 non-redundant protein (i.e. drug target) sequences are linked to these FDA approved drug entries. Each DrugCard entry contains more than 100 data fields with half of the information being devoted to drug/chemical data and the other half devoted to drug target or protein data.
References:
The Saliva Metabolome Database is a freely available electronic database containing detailed information about many small molecule metabolites found in human saliva and many concentration values. Each metabolite entry contains more than 110 data fields and many of them are hyperlinked to other databases (KEGG, PubChem, ChEBI, Chemspider, DrugBank, PDB and Uniprot). The information includes literature and experimentally derived chemical data, clinical data and molecular/biochemistry data.
References
The Urine Metabolome Database is a freely available electronic database containing detailed information about ~3100 small molecule metabolites found in human urine along with ~3900 concentration values. Each metabolite entry contains more than 110 data fields and many of them are hyperlinked to other databases (KEGG, PubChem, ChEBI, Chemspider, DrugBank, PDB and Uniprot). The information includes literature and experimentally derived chemical data, clinical data and molecular/biochemistry data.
References
FooDB is the world’s largest and most comprehensive resource on food constituents, chemistry and biology. It provides information on both macronutrients and micronutrients, including many of the constituents that give foods their flavor, color, taste, texture and aroma. It currently has data on over 26,500 food compounds and food associations.
Reference
The Toxic Exposome Database (TEDB ), also known as the Toxin and Toxin Target Database (T3DB) is a unique bioinformatics resource that combines detailed toxin data with comprehensive toxin target information. The database currently houses over 3,600 toxins described by over 41,000 synonyms, including pollutants, pesticides, drugs, and food toxins, which are linked to over 2,000 corresponding toxin target records. Altogether there are over 42,000 toxin, toxin target associations.
References:
1. Wishart D, Arndt D, Pon A, Sajed T, Guo AC, Djoumbou Y, Knox C, Wilson M, Liang Y, Grant J, Liu Y, Goldansaz SA, Rappaport SM. T3DB: the toxic exposome database. Nucleic Acids Res. 2015 Jan;43(Database issue):D928-34.
3. Wiki: http://en.wikipedia.org/wiki/T3DB
The Natural Product Magnetic Resonance Database (NP-MRD), is a freely available cloud-based, user-friendly, FAIR electronic database. NP-MRD accepts NMR data and associated metadata from newly undertaken NP studies. The NP-MRD accepts raw (time domain data, processed spectra, assigned chemical shifts, J-couplings, RDCs, etc.), and meta-data (structures, sources, methods, taxonomy, geospatial data, etc) from natural products ranging from purified substances to crude extracts, in all major solvents. The NP-MRD include NPs such as vitamins, minerals, and probiotics as well as small molecules derived from plants, fungi, bacteria, marine organisms, or animals. The NP-MRD accepts, converts, and stores all major vendor NMR formats and all major NMR data exchange formats from all common NMR experiments as well as new/uncommon NMR experiments or data sets. The NP-MRD have an intuitive user interface for spectra/structure deposition, retrieval, search, and analysis. Data deposition is fast (<5 min/per spectrum), easy and intuitive, and aided by online assignment and online spectra/structure visualization tools. Structure and assignment validation reports are generated within 5 minutes of deposition and value-added data reports are provided to users within 24 hrs of deposition, including high-quality DFT calculations of chemical shifts for a deposited structure. Data integrity and data quality are ensured by extensive curation efforts and the use of an objective ranking scale for all deposited data.
References
1. Wishart DS et al., NP-MRD: The Natural Products Magnetic Resonance Database, Nucleic Acids Research (2021)
The Small Molecule Pathway Database (SMPDB) is an interactive, visual database containing more than 618 small molecule pathways found in humans. More than 70% of these pathways (>433) are not found in any other pathway database. SMPDB is designed specifically to support pathway elucidation and pathway discovery in metabolomics, transcriptomics, proteomics and systems biology. It is able to do so, in part, by providing exquisitely detailed, fully searchable, hyperlinked diagrams of human metabolic pathways, metabolic disease pathways, metabolite signaling pathways and drug-action pathways.
References:
3. Wiki: http://en.wikipedia.org/wiki/SMPDB
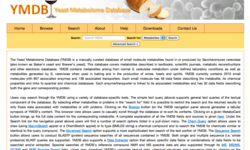
The Yeast Metabolome Database (YMDB) is a manually curated database of small molecule metabolites found in or produced by Saccharomyces cerevisiae(also known as Baker’s yeast and Brewer’s yeast). This database covers metabolites described in textbooks, scientific journals, metabolic reconstructions and other electronic databases. YMDB contains metabolites arising from normal S. cerevisiae metabolism under defined laboratory conditions as well as metabolites generated by S. cerevisiae when used in baking and in the production of wines, beers and spirits. YMDB currently contains 2010 small molecules with 857 associated enzymes and 138 associated transporters.
References:
2. Wiki: http://en.wikipedia.org/wiki/YMDB
The Microbial Metabolites Database (MiMeDB) is a freely available electronic database containing detailed information about small molecule metabolites found in the human microbiome. It is intended to be used for applications in metabolomics, clinical chemistry, biomarker discovery and general education. The database is designed to contain and link metabolite data, microbe data, host data, health and bioactivity data, and exposure data. Many data fields in the database are hyperlinked to other databases (FooDB, HMDB, KEGG, PubChem, MetaCyc, ChEBI, UniProt, and GenBank). The Microbial Metabolites Database supports extensive text, sequence, spectral, chemical structure and relational query searches.
References
1. Wishart DS et al., MiMeDB: the Human Microbial Metabolome Database, Nucleic Acids Research (2022)
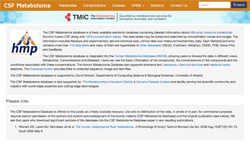
The CSF Metabolome Database is a freely available electronic database containing detailed information about 468 small molecule metabolites found in human CSF along with 1650 concentration values. The data tables may be sorted and searched by concentration values and ranges. The information includes literature and experimentally derived chemical data, clinical data and molecular/biochemistry data.
References:
The Re-referenced Protein Chemical shift Database (RefDB) is a database of carefully corrected or re-referenced chemical shifts, derived from the BioMagRes Bank. The process involves predicting protein 1H, 13C and 15N chemical shifts using X-ray or NMR coordinate data via SHIFTX and then comparing those predictions to the observed shifts reported in the BMRB (via SHIFTCOR). RefDB provides a standard chemical shift resource for NMR spectroscopists, wishing to derive or compute chemical shift trends in peptides and proteins.
References:
ChemFOnt (the Chemical Functional Ontology) is a hierarchical, OWL-compatible ontology describing the functions and actions of more than 341,000 biologically important chemicals. It is intended to bring the same rigor, standardization and formal structure to the terminology used in biochemistry, food chemistry and environmental chemistry as the gene ontology (GO) has brought to molecular biology. ChemFOnt is available as both a freely accessible, web-enabled database and a downloadable OWL file. Users may download and deploy ChemFOnt within their own chemical databases or integrate ChemFOnt into their own analytical software to generate machine readable relationships that can be used to make new inferences, enrich their metabolomic set data (metabolite set enrichment) or make new, non-obvious connections.
References
1. Wishart DS et al., ChemFOnt: the chemical functional ontology resource, Nucleic Acids Research (2022)
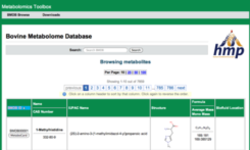
The Bovine Metabolome Database (BMDB) The Bovine Metabolome Database (BMDB) is a freely available electronic database containing detailed information about small molecule metabolites found in beef and dairy cattle. The information includes literature and experimentally derived information on bovine meat, bovine serum, bovine milk, bovine urine and bovine ruminal fluid.
References:
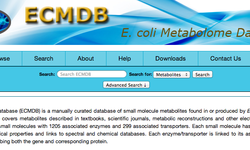
E. coli Metabolome Database (ECMDB) is a freely available eletronic database containing detailed information about the >3,700 metabolites found in E. coli (strain K12, MG1655). The information includes literature and experimentally derived information on the chemical data, spectral data and the molecular/biochemistry data.
References:
3. Wiki: https://en.wikipedia.org/wiki/E._Coli_Metabolome_Database
MarkerDB will be a freely available resource that attempts to consolidate information on all known clinical biomarkers into a single source. Multiple types of markers are covered including metabolite based, genetic based, protein based and cell based markers.

Exposome-Explorer is the first database dedicated to biomarkers of exposure to environmental risk factors for diseases. It contains detailed information on the nature of biomarkers, populations and subjects where measured, samples analyzed, methods used for biomarker analyses, concentrations in biospecimens, correlations with external exposure measurements, and biological reproducibility over time. This information can be used by epidemiologists and clinicians to compare the performance and field of application of various biomarkers and to identify specific biomarkers or panels of biomarkers most useful for biomonitoring or disease etiology studies.

Phenol-Explorer is the first comprehensive database on polyphenol content in foods. The database contains more than 35,000 content values for 500 different polyphenols in over 400 foods. These data are derived from the systematic collection of more than 60,000 original content values found in more than 1,300 scientific publications. Each of these publications has been critically evaluated before inclusion in the database.
The Alberta Food Composition Database (AFCDB) is the first comprehensive resource on food constituents, chemistry and biology dedicated to major Alberta-grown produce. It provides information on both macronutrients and micronutrients, including many of the constituents that give foods their flavor, color, taste, texture and aroma. Users can view the contents of the AFCDB from the “FoodView” (listing foods by their chemical composition) or the “ChemView” (listing chemicals by their food sources).
ResProx (Resolution-by-proxy or Res(p)) is a web server that predicts the atomic resolution of NMR protein structures using only PDB coordinate data as input. More specfically, ResProx uses machine learning techniques to accurately estimate (with a correlation coefficient of 0.92 between observed and calculated) the atomic resolution of a protein structure from 25 measurable features that can be derived from its atomic coordinates. Because atomic resolution is a simple and near-universal measure of structure quality (i.e. < 2.0 Å is good, > 4.0 Å is bad), ResProx offers X-ray crystallographers and NMR spectroscopists the opportunity to easily assess the accuracy and quality of their 3D protein structures. It also allows them to assess whether their refinement methods have made their structures better (or worse) than what the experimental data suggests. Furthermore, since coordinate data is common to both X-ray and NMR, ResProx should allow structural biologists to use a single, easily understood number to compare the structures determined by NMR with those determined by X-ray crystallography.
References:
2. Wiki: http://en.wikipedia.org/wiki/ResProx
RCI (Random Coil Index) webserver predicts protein flexibility by calculating the Random Coil Index from backbone chemical shifts (Cα, CO, Cβ, N, Hα, NH) and estimating values of model-free order parameters as well as per-residue RMSF of NMR and MD ensembles from the Random Coil Index.
References:
PHASTER (PHAge Search Tool Enhanced Release) is a significant upgrade to the popular PHAST web server for the rapid identification and annotation of prophage sequences within bacterial genomes and plasmids. While the steps in the phage identification pipeline in PHASTER remain largely the same as in the original PHAST, numerous software improvements and significant hardware enhancements have now made PHASTER faster, more efficient, more visually appealing and much more user friendly. In particular, PHASTER is now 4.3X faster than PHAST when analyzing a typical bacterial genome. PHASTER supports the ability to perform automated look-ups against >13,000 previously PHAST/PHASTER annotated bacterial genomes
References
MovieMaker is a web server that allows short (~10 sec), downloadable movies to be generated of protein dynamics. It accepts PDB files or PDB accession numbers as input and automatically outputs colorful animations covering a wide range of protein motions and other dynamic processes. Users have the option of animating 1) simple rotation 2) morphing between two end conformers 3) short-scale, picosecond vibrations; 4) ligand docking; 5) protein oligomerization; 6) mid-scale nanosecond (ensemble) motions; and 7) protein folding/unfolding. Note: MovieMaker is not a molecular dynamics server and does not perform MD calculations.
References:
Heatmapper is a freely available web server that allows users to interactively visualize their data in the form of heat maps through an easy-to-use graphical interface. Heatmapper is a versatile tool that allows users to easily create a wide variety of heat maps for many different data types and applications. Heatmapper allows users to generate, cluster and visualize: 1) expression-based heat maps from transcriptomic, proteomic and metabolomic experiments; 2) pairwise distance maps; 3) correlation maps; 4) image overlay heat maps; 5) latitude and longitude heat maps and 6) geopolitical (choropleth) heat maps. Heatmapper offers a number of simple and intuitive customization options for easy adjustments to each heat map’s appearance and plotting parameters.
References
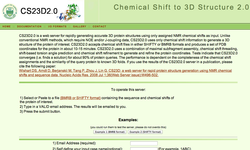
CS23D (Chemical Shift to 3D structure) 2.0 is a web server for rapidly generating accurate 3D protein structures using only assigned NMR chemical shifts as input. Unlike conventional NMR methods, which require NOE and/or J-coupling data, CS23D2.0 uses only chemical shift information to generate a 3D structure of the protein of interest. CS23D2.0 accepts chemical shift files in either SHIFTY or BMRB formats and produces a set of PDB coordinates for the protein in about 10-15 minutes. CS23D2.0 uses a combination of maximal subfragment assembly, chemical shift threading, shift-based torsion angle prediction and chemical shift refinement to generate and refine the protein coordinates. Tests indicate that CS23D2.0 converges (i.e. finds a solution) for about 90% of protein queries. The performance is dependent on the completeness of the chemical shift assignments and the similarity of the query protein to known 3D folds.
References:
2. Wiki: http://en.wikipedia.org/wiki/CS23D
Side-chain RCI webserver predicts protein side-chain mobility by calculating the Side-Chain Random Coil Index from side-chain chemical shifts and predicting per-residue RMSD of NMR and MD ensembles as well as fractional accessible surface area of protein residues from the Random Coil Index.
References
ClassyFire is a web-based application for automated structural classification of chemical entities. This application uses a rule-based approach that relies on a comprehensible, comprehensive, and computable chemical taxonomy. ClassyFire provides a hierarchical chemical classification of chemical entities (mostly small molecules and short peptide sequences), as well as a structure-based textual description, based on a chemical taxonomy named ChemOnt, which covers 4825 chemical classes of organic and inorganic compounds. It can be accessed via the web interface or via the ClassyFire API.
ClassyFire is offered to the public as a freely acessible web server. Use and re-distribution of the data, in whole or in part, for commercial purposes requires explicit permission of the authors and explicit acknowledgment of the source material (ClassyFire) and the original publication (see below). We ask that users who download portions of the database, or use the service (via the server or the API), cite the ClassyFire paper in any resulting publications.
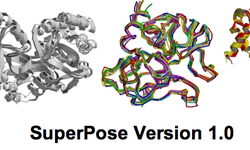
SuperPose is a protein superposition server. SuperPose calculates protein superpositions using a modified quaternion approach. From a superposition of two or more structures, SuperPose generates sequence alignments, structure alignments, PDB coordinates, RMSD statistics, Difference Distance Plots, and interactive images of the superimposed structures. The SuperPose web server supports the submission of either PDB-formatted files or PDB accession numbers.
References:
SHIFTX is a web server whihc can predict 1H, 13C and 15N chemical shifts for your favorite protein using only its PDB file as input. ShiftX uses a unique semi-empirical approach to calculate protein chemical shifts. Tests conducted on 47 different proteins indicate that program is able to achieve correlation coefficients between observed and calculated shifts of 0.911 (HA), 0.980 (CA), 0.996 (CB), 0.863 (CO), 0.909 (N), 0.741 (HN) and 0.907 (side H) with an RMS error of 0.23, 0.98, 1.10, 1.16, 2.43, 0.49, 0.30 ppm respectively.
References:
2. Wiki: https://en.wikipedia.org/wiki/ShiftX
VADAR (Volume, Area, Dihedral Angle Reporter) is a compilation of more than 15 different algorithms and programs for analyzing and assessing peptide and protein structures from their PDB coordinate data.
References:
2. Wiki: https://en.wikipedia.org/wiki/VADAR
PREDITOR is a program for PREDIcting φ, ψ, χ1, and ω TORsion angles in proteins from 13C, 15N and 1H chemical shifts and sequential homology. PREDITOR 30o-accuracy of predicting φ and ψ is close to 90%. The average χ1 accuracy is 84% while the ω accuracy is 99.98% for trans peptide bond identification and 93% for cis peptide bond identification. Overall, the program is 35X faster and its predictions are approximately 20% better than existing methods.
References:
GeNMR (GEnerate NMR structure) is a web server for generating 3D protein structures using NOE-derived distance restraints and NMR chemical shifts. The web server produces an ensemble of PDB coordinates within a period ranging from 20 minutes to 4 hours, depending on protein size, server load, quality and type of experimental information, and selected protocol options.
References:
2. Wiki: http://en.wikipedia.org/wiki/GeNMR
BioTransformer is a freely available software package for accurate, rapid, and comprehensive in silico metabolism prediction and compound identification. BioTransformer combines a machine learning-based approach with a knowledge-based approach to predict small molecule metabolism in human tissues (e.g. liver tissue), the human gut as well as the environment (soil and water microbiota), via its Metabolism Prediction Tool.
References:
1. Djoumbou Feunang Y, Fiamoncini J, de la Fuente AG, Manach C, Greiner R, and Wishart DS; BioTransformer: A Comprehensive Computational Tool for Small Molecule Metabolism Prediction and Metabolite Identification; Journal of Cheminformatics; 2018; Submitted
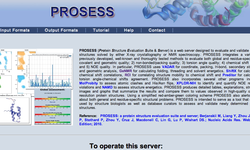
PROSESS (Protein Structure Evaluation Suite & Server) is a web server designed to evaluate and validate protein structures solved by either X-ray crystallography or NMR spectroscopy. PROSESS integrates a variety of previously developed, well-known and thoroughly tested methods to evaluate both global and residue-specific: 1) covalent and geometric quality; 2) non-bonded/packing quality; 3) torsion angle quality; 4) chemical shift quality and 5) NOE quality. In particular, PROSESS uses VADAR for coordinate, packing, H-bond, secondary structure and geometric analysis, GeNMR for calculating folding, threading and solvent energetics, ShiftX for calculating chemical shift correlations, RCI for correlating structure mobility to chemical shift and Preditor for calculating torsion angle-chemical shifts agreement. PROSESS also incorporates several other programs including MolProbity to assess atomic clashes and His/Asn flips, XPLOR-NIH to identify and quantify NOE restraint violations and NAMD to assess structure energetics. PROSESS produces detailed tables, explanations, structural images and graphs that summarize the results and compare them to values observed in high-quality or high-resolution protein structures. Using a simplified red-amber-green coloring scheme PROSESS also alerts users about both general and residue-specific structural problems. PROSESS is intended to serve as a tool that can be used by structure biologists as well as database curators to assess and validate newly determined protein structures.
References:
2. Wiki: http://en.wikipedia.org/wiki/PROSESS

PANAV is a Java based structure-independent chemical shift validation and re-referencing tool. It is based on using residue-specific and secondary structure-specific chemical shift distributions calculated over small (3-6 residue) fragments to identify mis-assigned resonances. The method is also able to identify and re-reference mis-referenced chemical shift assignments. Comparisons against existing re-referencing or mis-assignment detection programs show that the method is as good or superior to existing approaches.
A standalone version is available. Download here.
References:
1. Wiki: https://en.wikipedia.org/wiki/PANAV
Shiftcor compares, identifies, corrects and re-referencs 1H, 13C and 15N backbone chemical shifts of peptides and proteins by comparing the observed chemical shifts with the predicted chemical shifts derived from the 3D structure (PDB corrdinates) of the protein(s)of interest.
References:
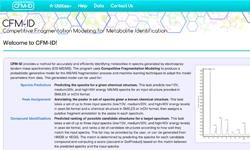
CFM-ID provides a method for accurately and efficiently identifying metabolites in spectra generated by electrospray tandem mass spectrometry (ESI-MS/MS). The program uses Competitive Fragmentation Modeling to produce a probabilistic generative model for the MS/MS fragmentation process and machine learning techniques to adapt the model parameters from data.
References:
1. Allen F, Greiner R, and Wishart D. Competitive fragmentation modeling of ESI-MS/MS spectra for putative metabolite identification. Metabolomics. February 2015, Volume 11, Issue 1, pp 98–110.
2. Allen F, Pon A, Wilson M, Greiner R, and Wishart D. CFM-ID: a web server for annotation, spectrum prediction and metabolite identification from tandem mass spectra. Nucleic Acids Res. June 2014.
MAGMET is a web system that automatically identifies and quantifies metabolites using 1D 1H NMR spectra of serum. The NMR spectra must be collected in a standardized fashion (see How To Collect NMR Spectra for MAGMET) for MAGMET to perform optimally. MAGMET first performs all spectral processing steps, including Fourier transformation, phasing, solvent filtering, chemical shift referencing, baseline correction and reference line shape convolution automatically. It then deconvolutes the resulting NMR spectrum using a reference spectral library, which here contains the signatures of more than 60 metabolites (see here for a list). This deconvolution process determines both the identity and quantity of the compounds in the biofluid mixture. Extensive testing shows that MAGMET meets or exceeds the performance of highly trained human experts.

Bayesil is a web system that automatically identifies and quantifies metabolites using 1D 1H NMR spectra of ultra-filtered plasma, serum or cerebrospinal fluid. The NMR spectra must be collected in a standardized fashion for Bayesil to perform optimally. Bayesil first performs all spectral processing steps, including Fourier transformation, phasing, solvent filtering, chemical shift referencing, baseline correction and reference line shape convolution automatically. It then deconvolutes the resulting NMR spectrum using a reference spectral library. This deconvolution process determines both the identity and quantity of the compounds in the biofluid mixture. Extensive testing shows that Bayesil meets or exceeds the performance of highly trained human experts.
References
1. Ravanbakhsh S, Liu P, Bjordahl TC, Mandal R, Grant JR, Wilson M, et al. Accurate, Fully-Automated NMR Spectral Profiling for Metabolomics. PLoS One. 2015 May 27;10(5):e0124219.
GC-AutoFit is a web application that automatically identifies and quantifies metabolites using Gas Chromatography Mass Spectrometry (GC-MS) spectra. For optimal GC-AutoFit performance, the query GC-MS spectra should be prepared according to the instructions (How to collect GC-MS Spectra for GC-AutoFit). GC-AutoFit currently accepts .CDF and .mzXML file formats. It uses alkane standards to calculate the retention index (RI) of each peak in the sample. The extracted EI-MS spectra from each peak, along with the RIs, are then compared to reference spectra (RIs and EI-MS) in the specified library to identify and quantify the compounds. The inclusion of blank spectra is optional, however, it is useful for removing noise effects from the query spectra. Extensive testing shows that GC-AutoFit meets or exceeds the performance of highly trained human experts.
The CSI (Chemical Shift Index) 2.0 web server is designed to accurately determine protein secondary structures from backbone chemical shifts (Cα, CO, Cβ, N, Hα, NH) and their corresponding protein sequence data. The server generates a text-based secondary structure assignment as well as a secondary structure graphics plot in ~90-120 seconds (if the PSIPRED prediction option is not used) or >300 seconds (if the PSIPRED prediction option is used). CSI 2.0 also provides a post-prediction Markov-model filtering (7-residue or 5-residue window) to remove the outliers in its final assignment
Reference:
LC-AutoFit is a web-application that is tailored for processing the raw Liquid Chromatography-Mass Spectrometry (LC-MS) spectra collected by the TMIC PRIME and TMIC MEGA metabolomics kits. LC-AutoFit automatically identifies and quantifies the medically important metabolites targeted by the TMIC PRIME and TMIC MEGA kits.
LC-AutoFit is compatible with AB Sciex, Thermo Orbitrap and Altis QTRAP instruments, and currently accepts the raw file formats that are collected from these instruments. LC-AutoFit can be used with blood, urine, and fecal samples. Users can download their quantitated results in .csv file format after data processing. For optimal performance, the query LC-MS spectra should be collected following the manuals provided with the TMIC RPIME and TMIC MEGA kits.
CSI (Chemical Shift Index) 3.0 web server is designed to identify 11 types of secondary and supersecondary structures. In particular, CSI 3.0 uses backbone NMR chemical shifts (Cα, CO, Cβ, N, Hα, NH) and sequence data to identify α helices, β strands, β turns (type I, II, VIII, I′ and II′), coil regions, β hairpins, interior β strands and edge β strands. The server generates a text-based secondary structure assignment as well as a colorful CSI plot (bar graphs) for small-medium sized proteins in approximately 2-5 minutes (depending on the size of proteins and the server load).
Reference:
The SHIFTASA web server is designed to accurately estimate residue-level fractional accessible surface area (fASA) from backbone and side-chain chemical shifts for water-soluble proteins. The server generates predicted per-residue fASA values and a corresponding graphics plot in ~90-120 seconds (if the evolutionary profile-based prediction option is not used) or >300 seconds (if the evolutionary profile-
based prediction option is used).
Reference:
CS-GAMDy (Chemical Shift driven Genetic Algorithm for Molecular Dynamics) is a program for refining protein structures using NMR chemical shifts as the only source of experimental information. The method employs biased quenched molecular dynamics, a multi-criterion genetic algorithm, several knowledge-based scoring functions, and structural information derived from NMR chemical shifts.
References
MetaboAnalyst is a comprehensive, Web-based tool designed for processing, analyzing, and interpreting metabolomic data. It handles most of the common metabolomic data types including compound concentration lists, spectral bin lists, peak lists, and raw MS spectra.
References:
PolySearch 2.0 is an online search engine and text-mining system for identifying relationships between human diseases, genes, proteins, drugs, metabolites, toxins, metabolic pathways, organs, tissues, subcellular organelles, positive health effects, negative health effects, drug actions, Gene Ontology terms, MeSH terms, ICD-10 medical codes, biological taxonomies and chemical taxonomies. PolySearch 2.0 supports a generalized 'Given X, find all associated Ys' query, where X and Y can be selected from the aforementioned biomedical entities.
References:
METAGENassist is a user-friendly, web-based analytical pipeline for comparative metagenomic studies. Input can be derived from either 16S rRNA data or NextGen shotgun sequencing.
References:
Proteus is a high-performing integrated web server and a stand-alone application three high-performing de novo structure prediction methods (PSIPRED, JNET and TRANSSEC [a locally developed predictor]), a jury-of-experts consensus tool and a robust PDB-based structure alignment process to generate all of its secondary structure predictions. For water-soluble protein Proteus is able to achieve a very high level of accuracy (Q3=88%, SOV=90%). In the rare situation (20-30%) where a query protein shows no similarity whatsoever to any known structure, PROTEUS is still able to achieve a Q3 score of 79%. Proteus is not restricted to generating accurate secondary structures for water-soluble proteins, as it appears to perform well for integral membrane proteins (both helix-containing proteins and beta-sheet containing porins) that have remote homologues or a portion of a homologue in the PDB.
References:
PROTEUS2 is a web server designed to support comprehensive protein structure prediction and structure-based annotation. PROTEUS2 accepts either single sequences (for directed studies) or multiple sequences (for whole proteome annotation) and predicts the secondary and, if possible, tertiary structure of the query protein(s). Unlike most other tools or servers, PROTEUS2 bundles signal peptide identification, transmembrane helix prediction, transmembrane β-strand prediction, secondary structure prediction (for soluble proteins) and homology modeling (i.e. 3D structure generation) into a single prediction pipeline.
References:
PANAV is a Java based structure-independent chemical shift validation and re-referencing tool. It is based on using residue-specific and secondary structure-specific chemical shift distributions calculated over small (3-6 residue) fragments to identify mis-assigned resonances. The method is also able to identify and re-reference mis-referenced chemical shift assignments. Comparisons against existing re-referencing or mis-assignment detection programs show that the method is as good or superior to existing approaches.
Version 2.1 of the standalone version is now available. Download here.
Older version: Download here.
A web version is also available.
Stand-alone program for protein decoy clustering and fold selection.
Reference:

SimCell is a DCA Cell simulator used to simulate cellular and biochemical processes.The user, through the use of the SimCell Interface may create: small molecules, membrane, membrane proteins, protein/RNA molecules, DNA molecules and Genes. These cellular components can then interact amongst themselves to create fascinating new processes.
References:
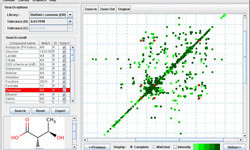
MetaboMiner is a tool which can be used to automatically or semi-automatically identify metabolites in complex biofluids from 2D NMR spectra. MetaboMiner is able to handle both 1H-1H total correlation spectroscopy (TOCSY) and 1H-13C heteronuclear single quantum correlation (HSQC) data. It identifies compounds by comparing 2D spectral patterns in the NMR spectrum of the biofluid mixture with specially constructed libraries containing reference spectra of approximately 500 pure compounds.
References:
Legacy web servers and applications are unmaintained. The source code and sites will be kept operational but we don't have the resources to fully support these programs.
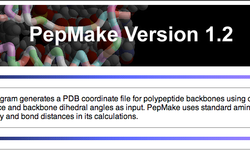
PepMake generates a PDB coordinate file for polypeptide backbones using only the sequence and backbone dihedral angles as input.
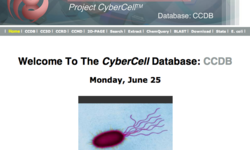
The CyberCell Database (CCDB) is a comprehensive, web-accessible database designed to support and coordinate international efforts in modeling an Escherichia coli cell on a computer. The CCDB brings together both observed and derived quantitative data from numerous independent sources covering many aspects of the genomic, proteomic and metabolomic character of E.coli (strain K12).
References:
MetATT is a easy-to-use, web-based tool designed for time-series and two-factor metabolomics data analysis. MetATT offers a number of complementary approaches including 3D interactive principal component analysis, two-way heatmap visualization, two-way ANOVA, ANOVA-simultaneous component analysis and multivariate empirical Bayes time-series analysis.
References:
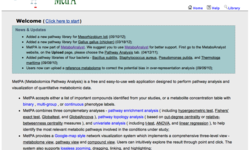
MetPA (Metabolomics Pathway Analysis) is a free and easy-to-use web application designed to perform pathway analysis and visualization of quantitative metabolomic data.
References:
2. Wiki: http://en.wikipedia.org/wiki/MetPA
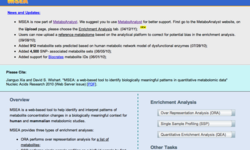
MSEA is a web-based tool to help identify and interpret patterns of metabolite concentration changes in a biologically meaningful context for human and mammalian metabolomic studies.
References:
2. Wiki: https://en.wikipedia.org/wiki/Metabolite_Set_Enrichment_Analysis
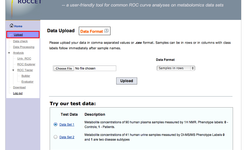
Receiver Operating Characteristic (ROC) curves are generally considered the method of choice for evaluating the performance of potential biomarkers. ROCCET is a freely available web-based tool designed to assist clinicians and bench biologists in performing common ROC based analyses on their metabolomic data using both classical univariate and more recently developed multivariate approaches.
References:
BASys (Bacterial Annotation System) is a web server that supports automated, in-depth annotation of bacterial genomic (chromosomal and plasmid) sequences.
References:
2. Wiki: http://en.wikipedia.org/wiki/BASys
GelScape is a web-based gel viewing and annotation system.
References:
With Shifty you can predict 1H, 13C, and 15N chemical shifts for your favourite protein using only its amino acid sequence as input. The technique uses dynamic programming to detect sequence homologies between your query and sequences of hundreds of previously assigned protein the BioMagResBank.
References:
SHIFTOR is a program for predicting φ, ψ, χ1, and ω torsion angles in proteins from 13C, 15N and 1H chemical shifts and sequential homology. For a test set of 31 proteins, SHIFTOR 30o-accuracy of predicting φ and ψ is close to 90%. The average χ1 accuracy is 81% while the ω accuracy is 99.98% for trans peptide bond identification and 93% for cis peptide bond identification. Overall, the program is 100X faster and its predictions are approximately 30% better than existing methods.
References:
PHAST(PHAge Search Tool) is a web server designed to rapidly and accurately identify, annotate and graphically display prophage sequences within bacterial genomes or plasmids. It accepts either raw DNA sequence data or partially annotated GenBank formatted data and rapidly performs a number of database comparisons as well as phage “cornerstone” feature identification steps to locate, annotate and display prophage sequences and prophage features. Relative to other prophage identification tools, PHAST is up to 40 times faster and up to 15% more sensitive. It is also able to process and annotate both raw DNA sequence data and Genbank files, provide richly annotated tables on prophage features and prophage “quality” and distinguish between intact and incomplete prophage. PHAST also generates downloadable, high quality, interactive graphics that display all identified prophage components in both circular and linear genomic views.Furthermore, tests indicate that PHAST is as accurate or slightly more accurate than all available phage finding tools, with sensitivity of 85.4% and positive predictive value of 94.2%.
References:
Proteome Analyst (PA) is an online tool used by researchers to rapidly analyze proteins. Using machine learning technologies, PA can accurately predict the subcellular localization and high level function of user submitted proteins.
Users can also analyze proteins using common bioinformatics tools such as: BLAST, HMMer, PROSITE, and PSIPRED.
References:
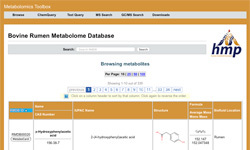
The Bovine Rumen Metabolome Database (RMDB) makes available tables containing the set of 246 ruminal fluid metabolites or metabolite species from the bovine ruminal fluid metabolome, along with their concentrations, related literature reference and links to their known diet associations. The data was collected by combining NMR spectroscopy, inductively coupled plasma mass-spectroscopy (ICP-MS), gas chromatography-mass spectrometry (GC-MS), direct flow injection (DFI) mass spectrometry and lipidomics with computer-aided literature mining to identify and quantify essentially all of the metabolites in bovine ruminal fluid that can be routinely detected with today’s technology.
The RMDB has been combined into the Bovine Metabolome DataBase (BMDB) and is no longer available on its own.
References
The COVIDmapper project is designed to provide geopolitical heatmaps showing the progression of COVID-19 spatially and temporally. COVIDmapper uses the Heatmapper platform (http://heatmapper.ca/) and spatio-temporal COVID data collected from the WHO, Johns Hopkins University, and a number of regional health centres from around the world (1,2). It also employs modeled data from reported and existing epidemiological trend data to predict future COVID trends ([1]). Data for COVIDmapper is updated daily at 0:00 GMT.
Using a simple pull-down menu, users can display COVID-19 heatmaps for different geographic levels: 1) the world, 2) continents, 3) individual countries, and 4) states or provinces. Data on the reported number of COVID cases, reported number of COVID deaths, reported per capita cases, reported per capita deaths, “real” number of cases (using 3 different case fatality rate models) and reported COVID tests can be easily displayed using COVIDmapper’s simple pull-down menu. Users may select any date to explore previous COVID statistics or any future date (based on modeled projections) to explore projected COVID statistics for different regions. Tables for all data in COVIDmapper (at the state, country, continent, or global level) are viewable as tables and can be freely downloaded. All maps are interactively zoomable and exact values are interactively displayed over each map by hovering over a region of interest. The intensity (opacity) of the heatmaps can be adjusted to display more (or less) of a country’s geography.